Add a GUI to your CLI apps with editable graphs, multiple terminals and asynchronous servers using Pipeline Manager
Published:
Topics: Open source tools, Edge AI
At Antmicro, we take a CLI-first approach to developing tools, providing clean and testable APIs as well as using them in continuous integration and other headless scenarios, which are frequently found in the industrial projects we work with. A CLI-first approach does not however prevent beautiful and user-friendly GUIs where they make sense; if anything, it makes implementing them in a structured way simpler. This blog note will illustrate how that can be done with the open source Pipeline Manager structured diagramming framework we introduced last year, which allows us to easily introduce a Web-based GUI to external applications that handle graph-based data or configurable flows representable in graph form.
Multiple, varied use cases
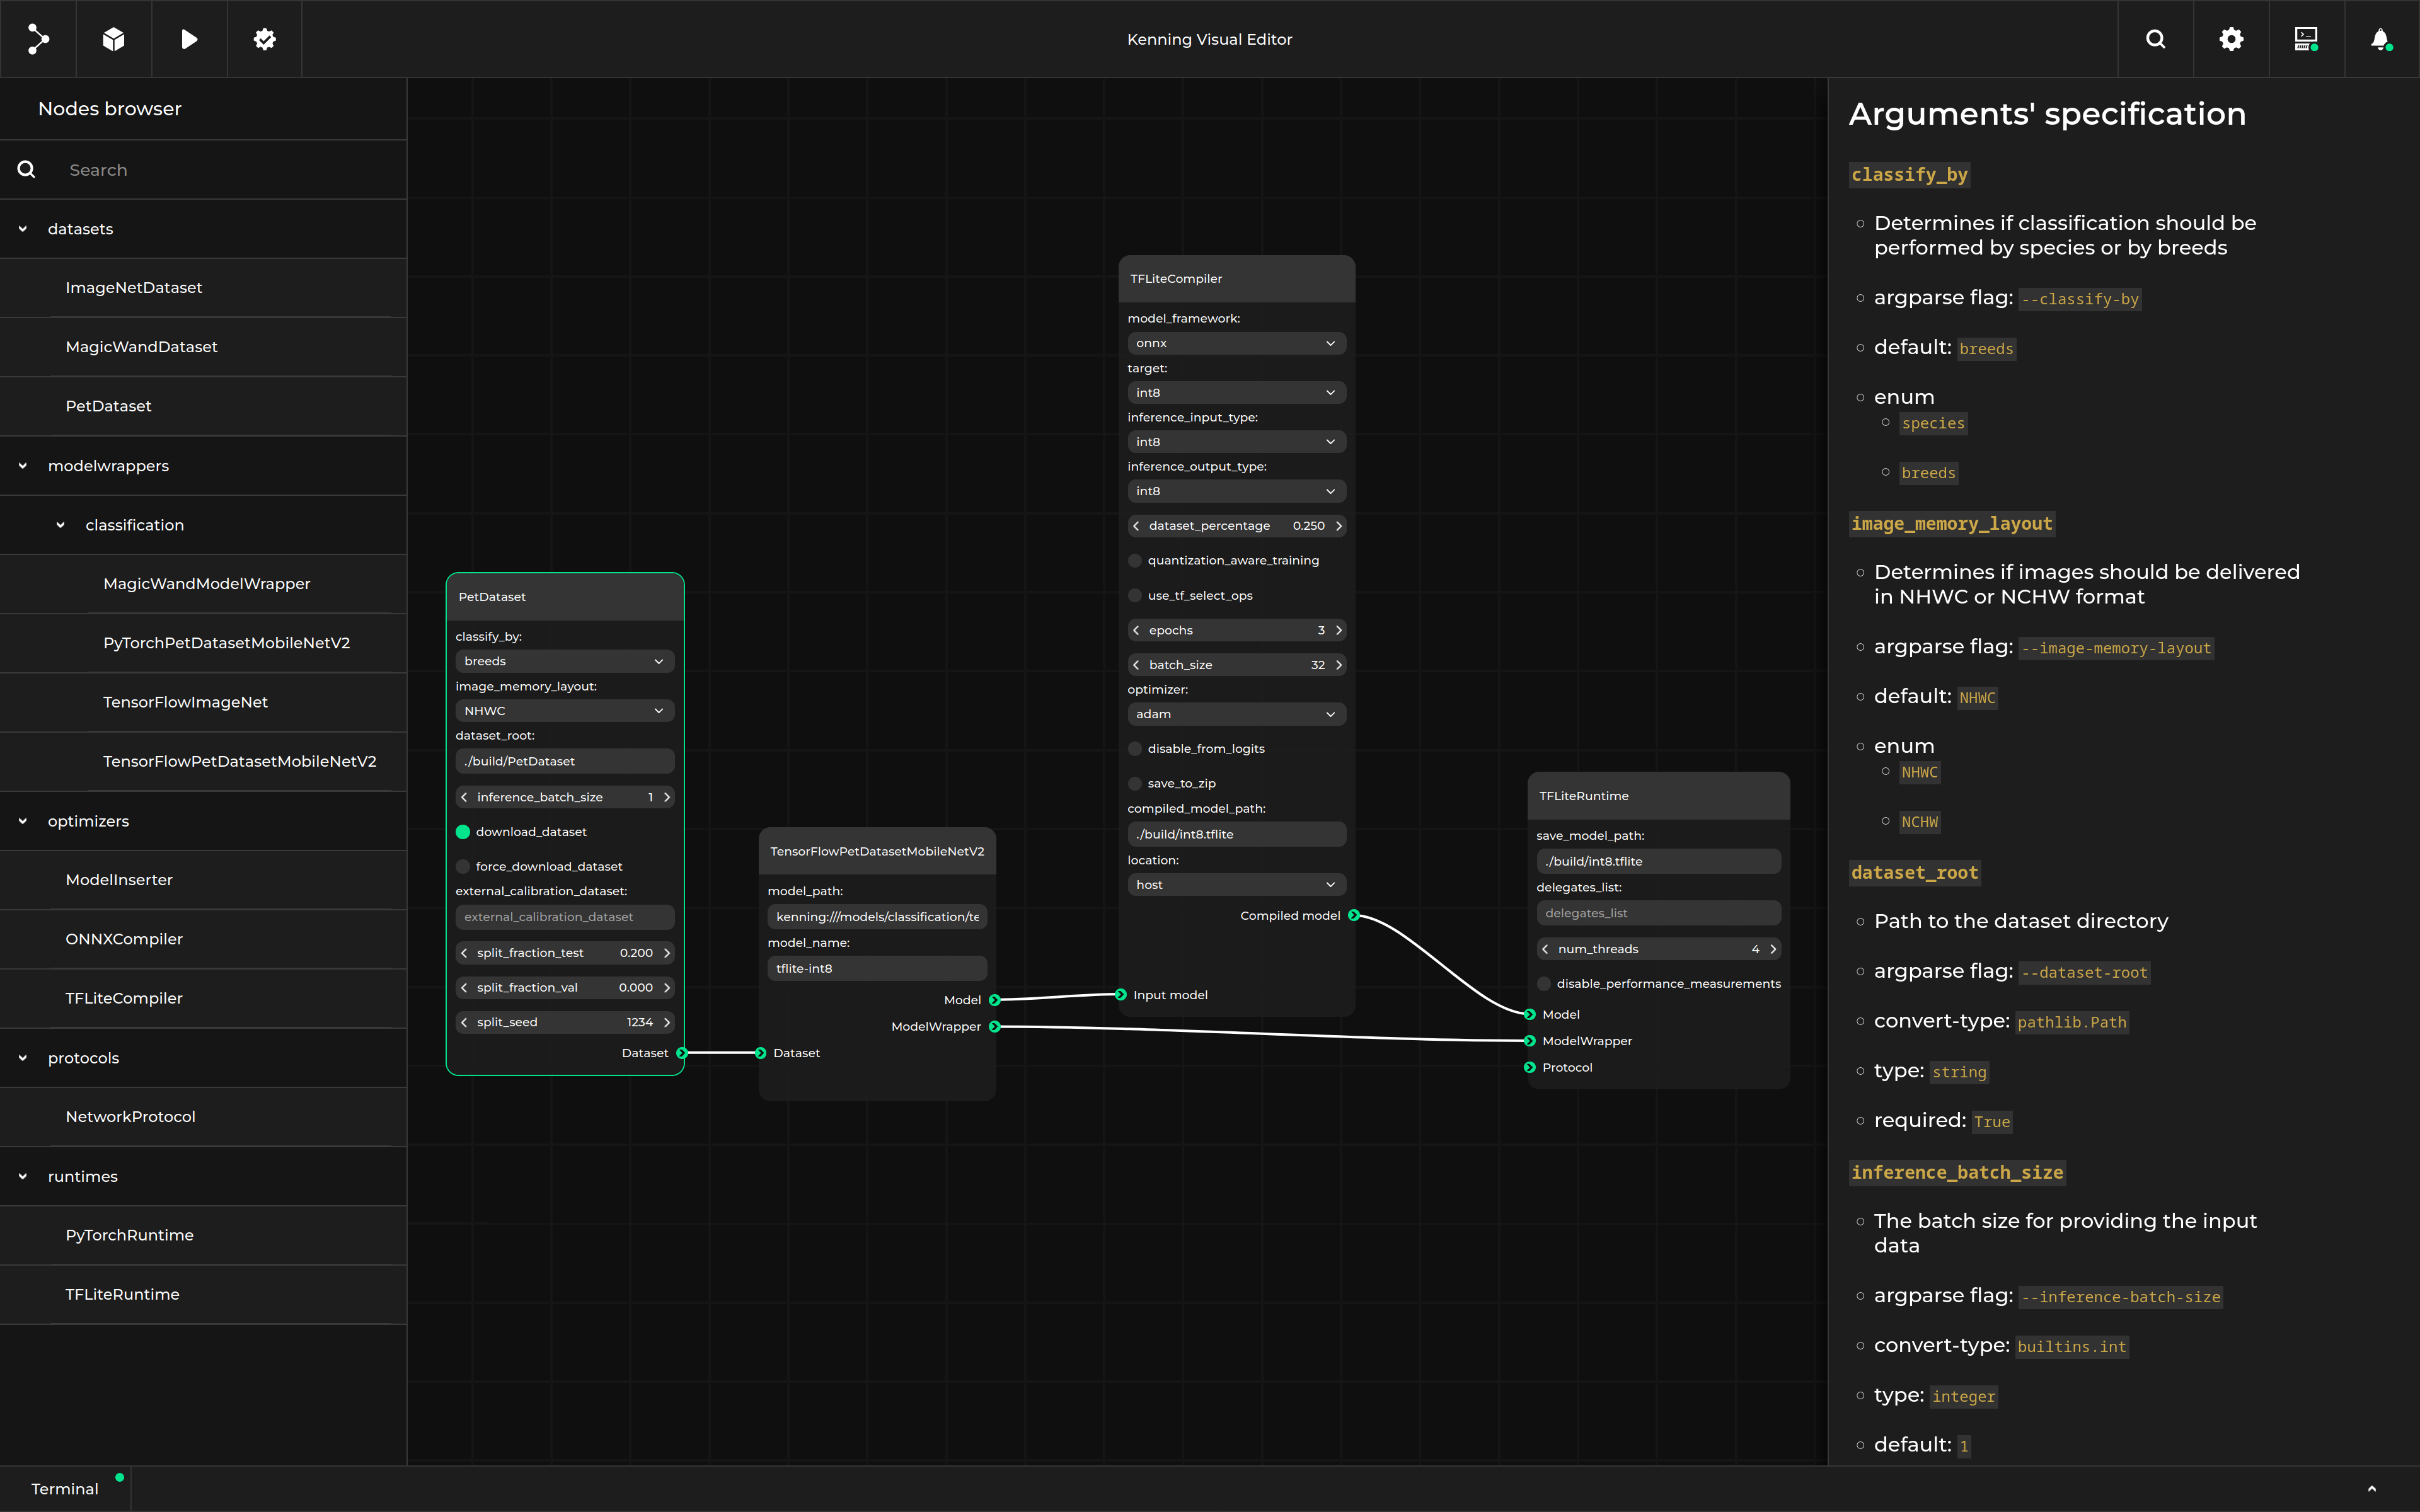
Pipeline Manager was initially developed in the context of our Kenning project, where we used it for creating deployment flows and runtimes for Deep Neural Network applications. The generic approach taken during that development meant it could be reused for a completely different use case, the Visual System Designer (VSD) tool for building and visualizing embedded boards in high-level graphical form with components and SoCs based on information from Zephyr, our Open Hardware Portal and Renode, which let us further refine and generalize Pipeline Manager as such.
Most recently, we have also brought in Pipeline Manager to some of our FPGA-related projects, such as FPGA Topwrap and AIG which is driving even more exciting updates.
And while we were at it, we also created a desktop application based on VSD, which in addition to building hardware block diagrams provides us with the ability to automatically build and run Zephyr RTOS applications on them using Renode.
Adopting Pipeline Manager in these tools has guided its recent developments towards better integration with external applications, including the ability to change its front end from the level of the external application for various purposes such as animations demonstrating how a board simulated in Renode controls physical LEDs.
Improved, two-way communication with wrapped applications
To achieve all the goals outlined in the section above, we needed to completely overhaul the communication between Pipeline Manager and a given application. Full two-way communication is now possible, initiated by either the front end or the application being represented in Pipeline Manager. This permits, for example, the application to send updates to the graph that will be immediately displayed on a website. It is possible to change the layout of individual nodes, change their properties, add/remove connections and more.
We also reimplemented the Pipeline Manager server (which integrates the application and the front end) so that it now works asynchronously and enables running long term tasks in the background while handling other requests simultaneously. The asynchronous server implementation requires only relatively simple code on the client (application) side, which boils down to completing asynchronous tasks, both for handling requests from the front end (importing and exporting graphs, running actions on graphs and modifying the graph on the website) and for sending requests to the front end (sending progress of actions, sending action results, sending notifications and sending terminal logs).
We have also created production-ready libraries for use in servers, which provides for a more stable and useful back end that utilizes uvicorn, python-socketio and uvloop.
Apart from bringing a graph-based UI to existing CLI applications, having two-way communication also brings other convenient use cases to the table. For example, a remote embedded application that runs some customizable flows can be represented with graphs. These could be multi-model execution pipelines, image processing pipelines or even ROS 2 graphs, depending on need.
With Pipeline Manager, we are able to quickly develop highly customizable and easy-to-use dashboards/UIs that allow users to easily change the underlying application, as well as visualize its progress, logs, actions, stages and more.
Formalized communication between the front end and application with JSON-RPC
In order to achieve full two-way communication between Pipeline Manager and external applications, we use a commonly used and well understood protocol in order to enhance interoperability with external applications - JSON-RPC.

The Remote Procedure Calls (RPCs) used in the communication process are formalized and validated using a schema, which is also used when generating documentation relating to available procedures in front end and back end applications and in common types. More details about the RPCs that provide for external app communication are available in Pipeline Manager documentation.
Tracking changes in the front end
With the introduction of asynchronous methods, two-way communication and RPCs, adding new procedures for analyzing graphics in the front end and manipulating them directly from the application became very straightforward to introduce.
Several possibilities exist for modifying the graphical representation of an application, including using features such as properties_change (changes the property of specified node), position_change (changes the position of the specified node) and nodes_change (modifies the entire graph structure) among others. With the advent of two-way communication, it is also possible to react to changes in the graph introduced by the front end, such as by using properties_on_change.
To demonstrate the capabilities of two-way communication, we implemented a “mirror” tester, which launches two Pipeline Manager instances, the second of which replicates what happens in the first.
To run the mirror tester after installing Pipeline Manager, use:
python -m pipeline_manager.frontend_tester.tester_mirror
You can also pass the --specification-path <path-to-spec> argument, where <path-to-spec> is a path to a custom specification file. After starting the mirror tester, open two addresses in your browser:
127.0.0.1:5000- Pipeline Manager instance in which we can modify the graph.127.0.0.1:5001- Pipeline Manager instance which reads events from the first instance and replicates them, giving a mirror-like view of changes in the first instance.
Another application that demonstrates interactive changes from the server’s level is the Visual System Designer app – there, we can simulate a Zephyr application in Renode, and show the changes in LEDs and print out the logs from UART, as shown in the project’s README video.
Server side implementation of RPC methods and custom navigation bar actions
Additionally, we significantly simplified callbacks for RPC - it only requires a simple class, e.g. RPCMethods that uses methods with the same names as RPC methods, and compatible types of inputs and outputs. An example of such a class is shown below:
from pipeline_manager_backend_communication.communication_backend import CommunicationBackend
from pipeline_manager_backend_communication.misc_structures import MessageType
from typing import Dict
import asyncio

# Class containing all implemented methods
class RPCMethods:
    def __init__(self, backend, specification):
        self.backend = backend
        self.specification = specification

    def specification_get(self) -> Dict:
        # ...
        return {'type': MessageType.OK.value, 'content': self.specification}

    def app_capabilities_get(self) -> Dict:
        return {
            "stoppable_methods": ["dataflow_run", "custom_check_constraints"],
        }

    # other callbacks for RPC...

    def dataflow_run(self, **kwargs: Dict) -> Dict:
        # All params can also be retrieved as one dictionary
        print(kwargs['dataflow'])
        # ...
        # everything went fine, returning OK status
        return {'type': MessageType.OK.value}

    # Custom procedure example
    async def custom_check_constraints(self, dataflow: Dict) -> Dict:
        # set progress of the task to "ongoing"
    await self.backend.request(
        "progress_change",
        {"method": "custom_check_constraints", "progress": -1}
    )
        # ...
        # everything went fine, returning OK status
        return {'type': MessageType.OK.value}

async def start_listening(host, port, specification):
    backend = CommunicationBackend(host, port)
    await backend.initialize_client(RPCMethods(backend, specification))
    await backend.start_json_rpc_client()

# ...

asyncio.run(start_listening(host, port, specification))
As shown above, all methods usually accept arguments representing the current state or changes in the front end, and they later return a JSON dictionary, with at least the status of the method (e.g. specification_get returns a specification of the node types).
We can either use existing RPC calls for actions on the graph (e.g. dataflow_run, and the full list can be found in the documentation), or we can define new, custom RPC methods which need to be prefixed with custom_ , e.g. custom_check_constraints. This way, we can add new buttons to the top navigation bar in the front end, allowing developers to add new actions to graphs, specific to their use cases. In Kenning, we have Run and Validate options, which will soon be followed by Optimize, Evaluate and Report buttons. In the Visual System Designer app, we have Build and Simulate buttons. In order to display names and icons in the front end Navigation Bar for such actions, we just need to add an entry to the specification’s metadata under navbarItems, such as:
{
    "metadata":
    {
        "navbarItems":
        [
            {"name": "Run", "iconName": "run.svg", "procedureName": "dataflow_run"},
            {"name": "Check constraints", "iconName": "constraints.svg", "procedureName": "custom_check_constraints"}
        ]
}
The tasks that are available in the Navigation Bar can be executed in parallel, if an underlying application supports it, or stopped. Further information relating to which methods are stoppable can be provided by the app_capabilities_get RPC method, which is called by the front end at the start of the application. Visually, the state of each task is represented by progress bars individual to each task, which can be updated from the application level with a progress_change RPC request to the front end. It accepts a method name, in which the progress is specified, and the current progress state value, which can be either a progress percentage in a form of integer from 0 to 100, or -1 if the progress state is unknown, but we want to mark the task as ongoing. An example for updating the progress is shown in the code snippet above, in the custom_check_constraints method.
Creating multiple terminals, visualizing data coming from the CLI
While a GUI simplifies the process of designing and customizing graphs, using a CLI is still superior in terms of understanding the precise mechanics of the application, identifying potential or actual points of failure and providing insight into which stage the application is currently at during processing. To address this limitation of the Pipeline Manager, we added the possibility to stream logs printed in the terminal by the underlying CLI tool in Pipeline Manager. We can send the contents of the terminal, including escape sequences (e.g. for coloring the logs) using the terminal_write remote procedure.
We also added the possibility to have multiple terminals, which are addressed in the terminal_write method by the name field, which later appears as a terminal tab name. This means that the user can display multiple terminals at once, while it is possible to write to them in parallel from the application using the new terminal_write remote procedure.
In order to have a fully functional terminal emulator render the text sent with the terminal_write procedure, we decided to use hterm.js from the libapps project. With hterm.js we are able to render colors, use all kinds of escape symbols and manipulate the terminal view.
Creating user-friendly GUIs for remote devices and CLI applications
As the result of our intensive work on Pipeline Manager, we are able to customize new and existing frameworks to match specific customer needs. With the help of Pipeline Manager, we can adapt a range of CLI tools to work directly in a browser without sacrificing usability and flexibility, while still presenting the required information in a graphical format. Pipeline Manager is not limited to just software targets, as it can connect to a wide range of data sources, such as cameras or other hardware devices, especially for the purpose of Deep Neural Network training.
If you would like to discuss how Antmicro can adapt Pipeline Manager to fit your custom solutions, as well as adjust it to match your specific software and hardware use cases, be it AI, ASIC development, robotics, system design or other, get in touch with us – contact@antmicro.com.