Pipeline Manager: Improved data validation, subgraphs, QoL changes, and more
Published:
Topics: Open source tools, Edge AI
When working with abstract concepts such as building machine learning data flows in Kenning or designing an FPGA platform with FPGA Topwrap, the ability to represent the data in an easily understandable form can greatly improve the developer experience and make it easier to comprehend all relationships between the components of your code.
With this motivation in mind, Antmicro developed Pipeline Manager, an open source, data-driven, application-agnostic web tool that allows you to create, visualize, and manage data flows from applications like Kenning or visualize embedded systems with the recently released Visual System Designer. Pipeline Manager has been in active development since its initial release and can now boast a number of new features and QoL updates that make complex use cases like Visual System Designer possible.
In this note, we describe the new features, including a complete graphical overhaul and performance enhancements, and how they can help you visualize almost any tree-like or flow-like data.

Using Pipeline Manager as a Python module
In its previous iterations, Pipeline Manager required for data sources to be cloned locally in order to be accessible, its front end needed to be built in the cloned repository, and a Pipeline Manager server needed to be run separately from the back end it was working with, e.g. Kenning.
In the current form, the tool is available as a Python module, easily installed by running:
pip3 install git+https://github.com/antmicro/kenning-pipeline-manager.git
This provides users with a pipeline_manager tool which builds the front end, validates the specification and graph files as well as runs the server. It also provides a pipeline_manager module which provides the functionalities mentioned above available using Python, equipped with additional features like constructing a specification, or starting Pipeline Manager along with the back end it is used with.
Now, to build the standalone Pipeline Manager front end, we can call:
pipeline_manager build static-html --workspace-directory ./workspace-dir ./specification-file.json
We can also add a default graph with:
pipeline_manager build static-html --workspace-directory ./workspace-dir ./specification-file.json --output-directory ./pipeline-manager ./graph.json
The script also allows us to build a standalone HTML with the --single-html <out.html> flag, provide additional assets (graphics for nodes, icons for links to additional resources, etc.) using --assets-directory <directory>, and enable/disable rendering of the interface in a graph.
The --workspace-directory flag points to where the Pipeline Manager should build the frontend and store its sources and --output-directory defines where the built page will be saved. To start the Pipeline Manager, open the ./pipeline-manager/index.html file in your preferred browser.
Formalized specifications and improved data validation
With the new developments, both specifications and data flows are much more verbose and explicit, and validation is more rigorous to avoid any inconsistencies and hidden issues. All data formats are now standardized, and Pipeline Manager verifies correctness of the data using JSON schemas, resulting in more readable, traceable error messages and faster debugging. All logs are now displayed in a separate panel for quicker and more convenient debugging.
Pipeline Manager now checks the integrity of connections, interfaces, and entire nodes, making it easier for the user to create a valid data flow and specification. All available nodes in your specification need to be defined in a JSON file which, in addition to defining properties and interfaces, categorizes elements for easy browsing and lists available interfaces.
To validate the specification, run:
pipeline_manager validate --workspace-directory ./workspace-dir ./specification-file.json ./graph-file.json
This command uses the same validation as the front end when loading graphs for visualization, allowing you to quickly check the validity of a created specification e.g. in a CI flow. The same is accessible using a Python script:
from pathlib import Path
from pipeline_manager.validator import validate

validate(
    specification_path=Path("specification-file.json"),
    dataflow_path=Path("graph-file.json"),
    workspace_directory=Path(“./workspace_directory”)
)
Constructing specifications in Python with SpecificationBuilder
To further simplify the integration of Pipeline Manager with new tools, we created the SpecificationBuilder class allowing users to construct definitions of node types based on their data using simple Python methods.
First, we create a SpecificationBuilder instance:
from pathlib import Path
from pipeline_manager.specification_builder import SpecificationBuilder

SPECIFICATION_VERSION = "20230830.11"
ASSETS_DIRECTORY = Path("./assets")

builder = SpecificationBuilder(
    spec_version=SPECIFICATION_VERSION,
    assets_dir=ASSETS_DIRECTORY,
    check_urls=True
)
SpecificationBuilder, in addition to constructing the specification, validates whether assets addressed in the paths to icons, visualizations, etc. are present in the provided ASSETS_DIRECTORY and whether URLs to remote assets, as well as URLs for node types are available and without errors.
With the builder, we can define a new node type using add_node_type:
builder.add_node_type(
    name="Image threshold",
    category="Processing/Binary images"
)
Then, we can add interfaces to the created node type using add_node_type_interface:
builder.add_node_type_interface(
    name="Image threshold",
    interfacename="input image",
    interfacetype="color_image",
    direction="input",
    side="left"
)

builder.add_node_type_interface(
    name="Image threshold",
    interfacename="output image",
    interfacetype="binary_image",
    direction="output",
    side="right"
)
We can also add properties using add_node_type_property:
builder.add_node_type_property(
    name="Image threshold",
    propname="threshold type",
    proptype="select",
    values=["constant", "adaptive", "otsu"],
    default="constant",
    description="Type of threshold algorithm"
)

builder.add_node_type_property(
    name="Image threshold",
    propname="threshold level",
    proptype="slider",
    min=0,
    max=255,
    default=128,
    description="Base threshold value"
)
More details and available functions are described in the SpecificationBuilder documentation chapter.
Running Pipeline Manager in your application
As mentioned above, Pipeline Manager can now start the server in parallel to running the application via a Python script using:
from pipeline_manager.backend.run_in_parallel import start_server_in_parallel, stop_parallel_server
from pipeline_manager_backend_communication.communication_backend import CommunicationBackend
from pipeline_manager_backend_communication.misc_structures import MessageType

# ...
client = CommunicationBackend(host, port)
# register callbacks for messages
client.register_callback(MessageType.RUN, run_callback)
client.register_callback(MessageType.VALIDATE, validate_callback)
# ...
# start the Pipeline Manager server
start_server_in_parallel(workspace_dir)
# connect the client to the Pipeline Manager server
client.initialize_client()
# process...
# close the server
stop_parallel_server()
The start_server_in_parallel loads or creates a workspace directory in a given path, builds the frontend if necessary and runs the web application, and CommunicationBackend communicates with it, handles various requests and sends a specification based on information provided by the application it is used with. You can decide how to handle specific message types using simple callbacks.
With CommunicationBackend, SpecificationBuilder and the pipeline_manager.backend.run_in_parallel module, it is possible to easily integrate Pipeline Manager into various existing applications.
Improvements in node type search
Searching within Pipeline Manager got more intuitive and more comprehensive with an array of new features enabled by a new sidebar. The sidebar features a category view, where you can browse available nodes with a clear, overlying structure. For each node type it is also possible to add graphical assets, e.g. 3D renders as in the case of VSD, and icons with URLs to additional resources pertaining to a given node type, like sample Renode/Zephyr tests in Renodepedia or Blender files and KiCad footprints on Antmicro’s Open Hardware Portal.
Once you pick a node from the sidebar, you can now drag-and-drop it onto the canvas. If you would rather search for your desired node instead of browsing through a list, we have also introduced fuzzy search to the tool to make it easier and more intuitive.
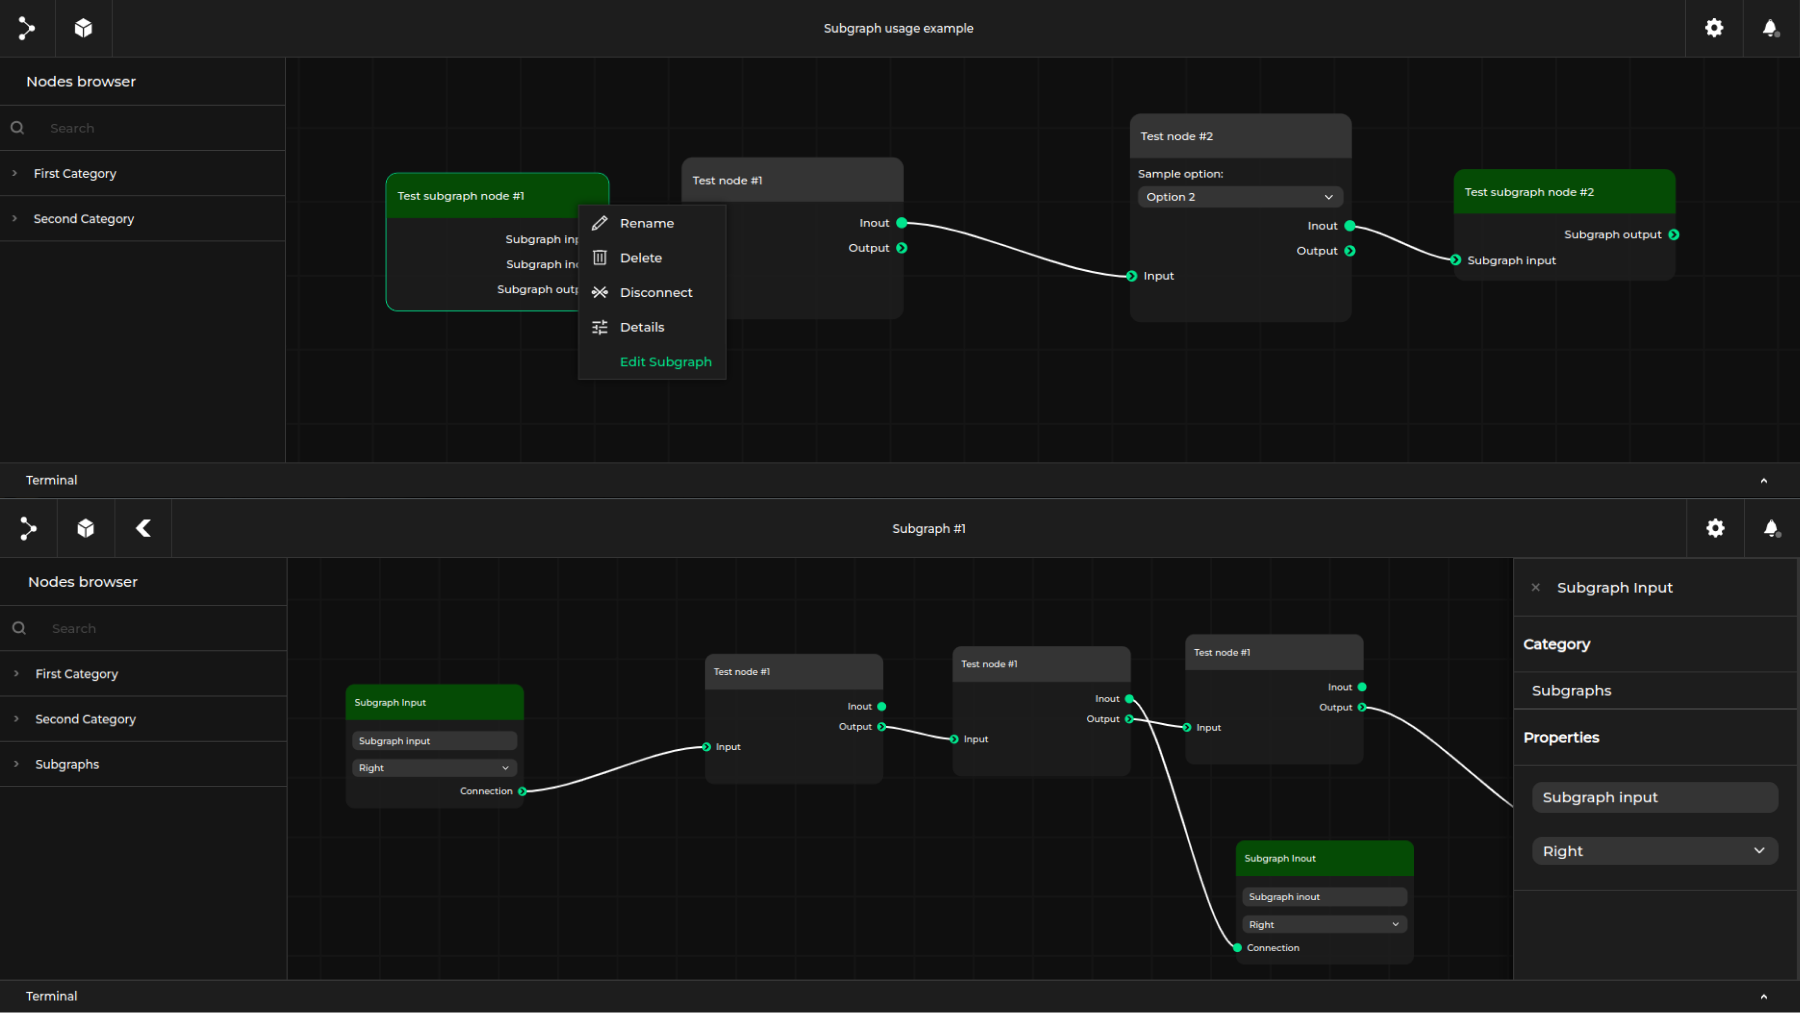
Introducing subgraphs and node inheritance
As many graphs are multi-layered with certain structures recurring throughout the design, we added a possibility to reuse such constructs in the form of nodes containing these graphs, called subgraphs. They simplify the organization in large designs and they can be easily freely imported, parameterized, and reused using the Pipeline Manager frontend. The user can also choose which of the interfaces exposed by the nodes within a subgraph are exposed on a higher level.
To speed up development of new flows, you can now use node inheritance to create shorter and more structured specifications. When you create a specification, you can have your new nodes inherit the interfaces and properties of existing nodes to enable faster prototyping by eliminating repetition from your specification.
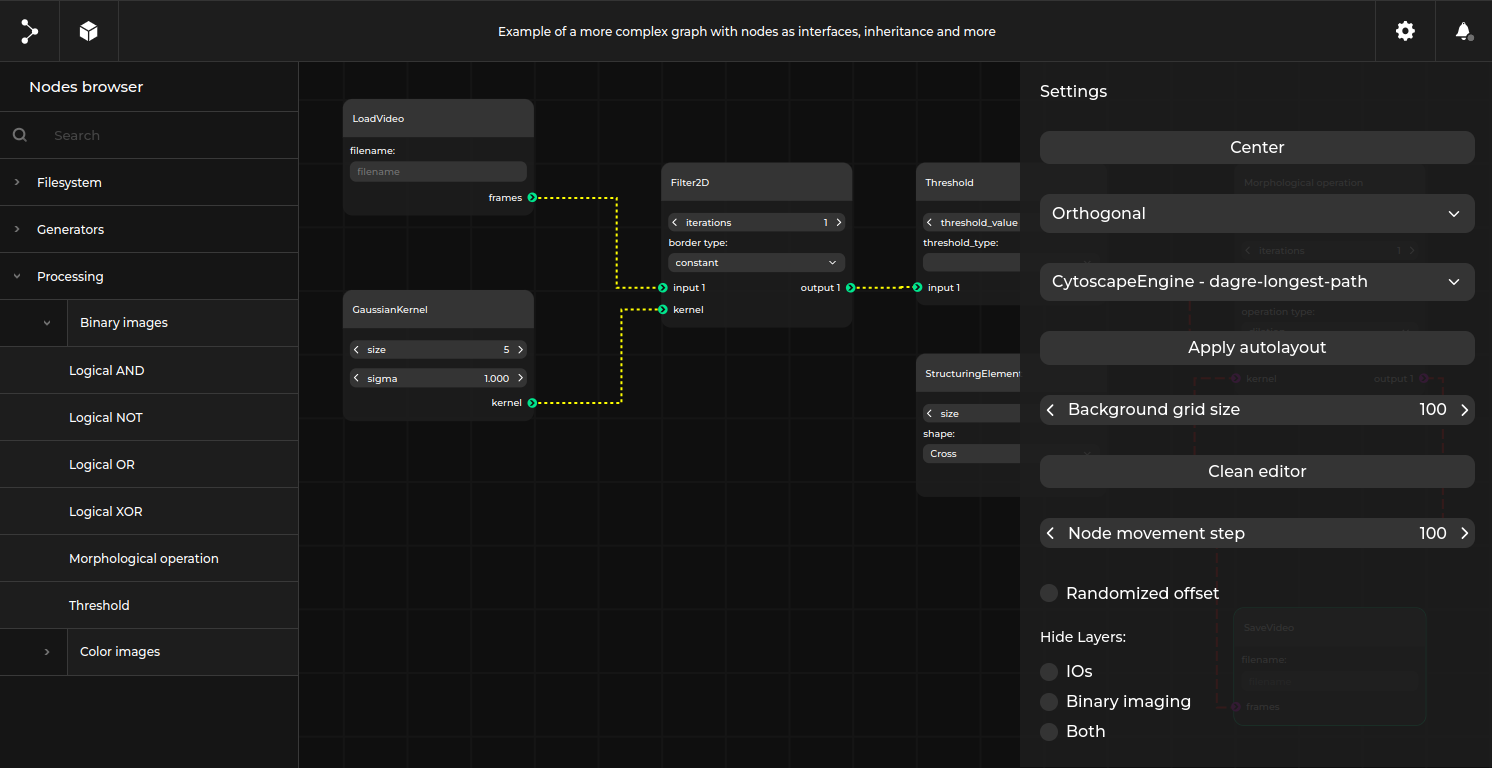
Editor UX enhancements and other optimizations
Changes to Pipeline Manager’s interface also include the editor’s canvas. You can further customize your graph visualizations by naming them, adding connection anchors, and configuring interface layouts to place connections in the most convenient locations using a variety of auto-layout algorithms.
In addition, the following features have been introduced to the canvas area:
- Copying/pasting nodes
- Multi-node selection
- Improvements to node rendering (grayed-out node types, aesthetic improvements)
- Grid-based movement (snap-to-grid, align-to-node)
- On-hover node connection highlighting
- Interface and connection styling
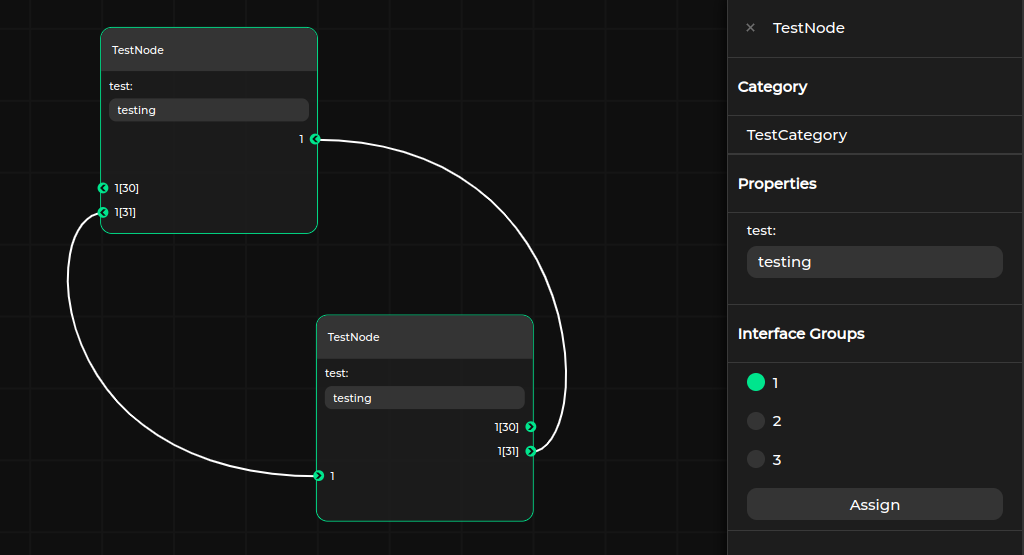
For easier access to certain controls, we have added a separate sidebar settings menu where the user can:
- Configure graph/node properties
- Adjust interface grouping
- Add/access Markdown-based node documentation
- Add/access links to resources.

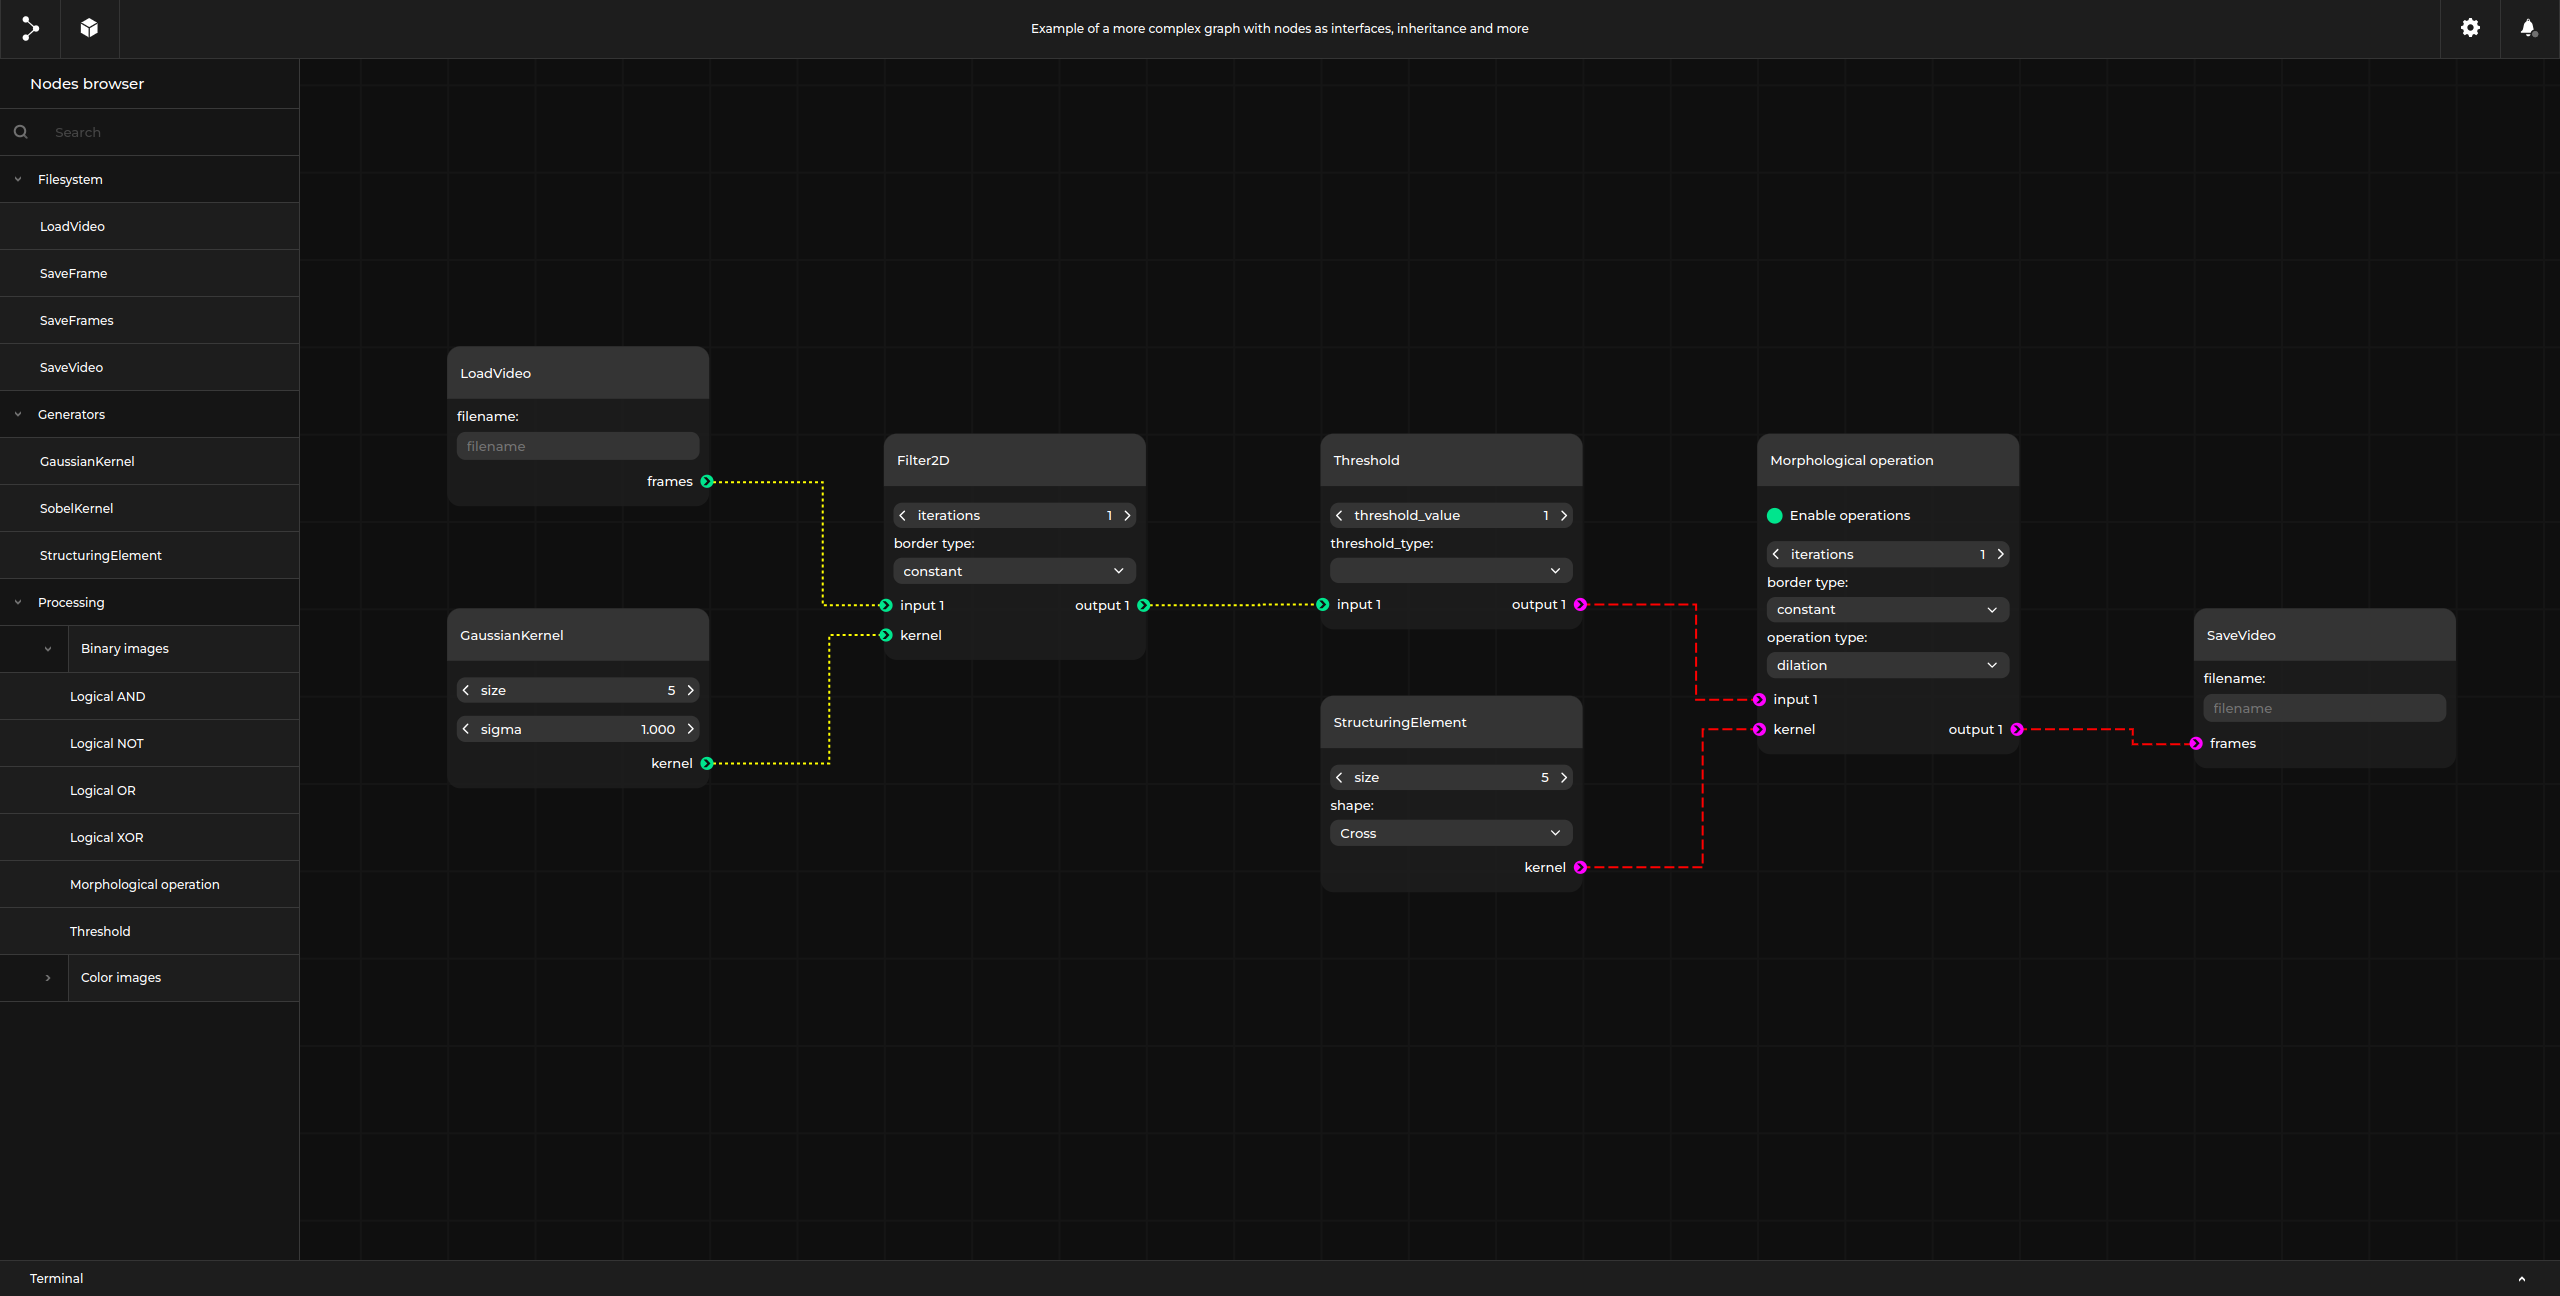
You can explore Pipeline Manager’s UX with a sample graph for yourself through the online demo page or below (desktop only):
Visualize complex block diagrams and data flows with Pipeline Manager
Pipeline Manager is a useful open source tool for editing workflow graphs, fine-tuning and systematizing development, even for less technical users. It offers great productivity advantages in large projects such as AI-enabled industrial applications. Pipeline Manager can be easily extended to integrate with more apps and help you visualize any graph-like structure, even entire embedded systems like in the case of Antmicro’s Visual System Designer.
If you are interested in developing a comprehensive workflow benefiting from Pipeline Manager’s visualization, editing and validation capabilities, or integrating it with your own tools, reach out to Antmicro at contact@antmicro.com.